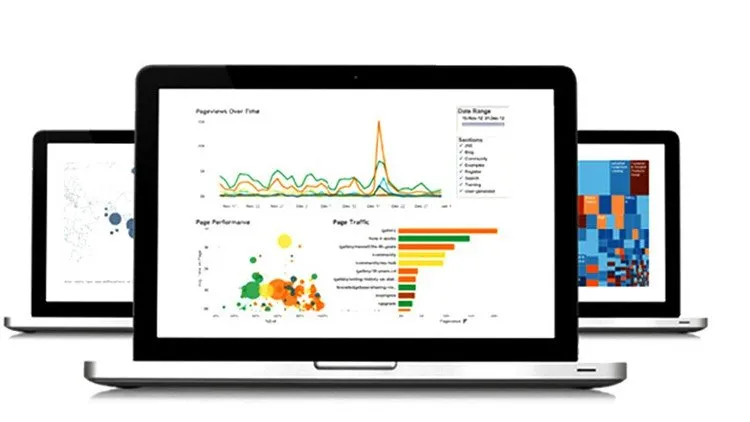
Tableau 2021 A-Z : Master Tableau for Data Science and BI
Tableau for Data Visualization, Business Intelligence (BI) and Data Science

Tableau 2021 A-Z : Master Tableau for Data Science and BI udemy course
Tableau for Data Visualization, Business Intelligence (BI) and Data Science
What you'll learn:
- Install Tableau Desktop 2020
- Connect Tableau to various Datasets: Excel and CSV files
- Create Barcharts
- Create Area Charts
- Create Maps
- Create Scatterplots
- Create Piecharts
- Create Treemaps
- Create Interactive Dashboards
- Create Storylines
- Understand Types of Joins and how they work
- Work with Data Blending in Tableau
- Create Table Calculations
- Work with Parameters
- Create Dual Axis Charts
- Create Calculated Fields
- Create Calculated Fields in a Blend
- Export Results from Tableau into Powerpoint, Word, and other software
- Work with Timeseries Data (two methods)
- Creating Data Extracts in Tableau
- Understand Aggregation, Granularity, and Level of Detail
- Adding Filters and Quick Filters
- Create Data Hierarchies
- Adding Actions to Dashboards (filters & highlighting)
- Assigning Geographical Roles to Data Elements
- Advanced Data Preparation (including latest updates in Tableau 9)
Requirements:
- Basic knowledge of computers
Description:
Learn "complete Tableau" within 10 hours.
This course covers A-Z of Tableau for Data Visualization, Business Intelligence (BI) and Data Science.
It is intended to make the learners switch from a Beginner to an Expert level, so as to master the Tableau.
This course has been made into 10 sections and covers all the Tableau topics as mentioned below:
1. Introduction to BI & Tableau, Tableau Products, Tableau connections to Data Sources, Interface and Terminologies.
2. Sharing of Tableau work (Publishing the work into Tableau Public Server).
3. Data Types, Dimension Vs Measure, Continuous Vs Discrete Data, Aggregations and Automatic Fields generated by Tableau.
4. Combining data using Joins, Data Blending and Union.
5. Organizing & Simplifying Data (using Filters, Split, Sorting, Groups, Sets and Hierarchy).
6. Basic Charts:
Bar Charts
Histogram
Pie Charts
Line & Sparkline Chart
Combination Charts
Text Tables
Heat Map
Tree Map
7. Advanced Charts:
Box & Whisker Plot
Scatter Plot
Bullet Charts
Pareto Charts
Waterfall Charts
Gantt Charts
Motion Charts
Geographic Maps
8. Advanced Tableau topics [Calculations, Parameters and Level of Detail (LOD) expressions].
9. Analytics using Tableau – Trends, Predictive Analytics / Forecast and Instant Analytics.
10. Creating effective and interactive Dashboards & Story.
The course covers the theoretical aspects of each of the above topics followed by demo on each concept/technique. Also, assignments are included to enable the learner apply various concepts. Finally, quizzes are made available at the end of each section to check the understanding of the learner on various concepts.
Wish you Happy Learning!
Who this course is for:
- Students / Learners interested in Data Visualization, Business Intelligence (BI) & Data Science
- Beginners into Business Intelligence
- Business Analysts & Data Analysts
- Beginners to Experts in Data Science domain
- All those who wish to "tell Stories" using Data Visualization
- Testing Ruby with RSpec: The Complete Guide
- Learn AWS - Deploy Java Spring Boot to AWS Elastic Beanstalk
- JavaScript Algorithms
- Build a Blockchain & Cryptocurrency using Python
Course Details:
- 9.5 hours on-demand video
- 13 downloadable resources
- Full lifetime access
- Access on mobile and TV
- Assignments
- Certificate of completion
Tableau 2021 A-Z : Master Tableau for Data Science and BI udemy free download
Tableau for Data Visualization, Business Intelligence (BI) and Data Science
Demo Link: https://www.udemy.com/course/tableau-2021-a-z-master-tableau-for-data-science-and-bi/
